 Mr. Hà
 live:ha_1652
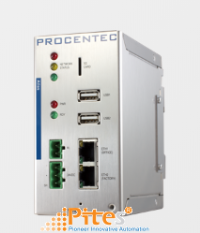
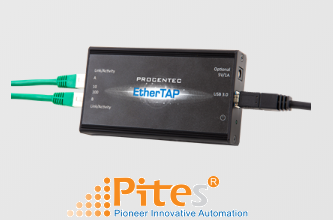
PROCENTEC is taking diagnostics to the next level. The new EtherTAP monitoring interface is the bridge to the Osiris functionality on our portable Mercury tablet and permanent Atlas module. Both devices run on diagnostics platform Osiris to analyse the information feed from the EtherTAP. This enables our build-in assistant Delphi to come up with a solution to help you to quickly and effectively get your operations running again.
- Passive diagnostics
- Cycle time per device
- Positive and negative message jitter
- Number of dropped packets
- Alarm Triggers
Product overview
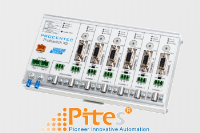
EtherTAP 10/100
513-00011A

PROCENTEC is taking diagnostics to the next level. The new EtherTAP monitoring interface is the bridge to the Osiris functionality on our portable Mercury tablet and permanent Atlas module. Both devices run on diagnostics platform Osiris to analyse the information feed from the EtherTAP. This enables our build-in assistant Delphi to come up with a solution to help you to quickly and effectively get your operations running again.
- Passive diagnostics
- Cycle time per device
- Positive and negative message jitter
- Number of dropped packets
- Alarm triggers
The EtherTAP – Message Analysis feature allows you to do deep analysis of PROFINET traffic by placing an EtherTAP between devices exchanging PROFINET traffic (usually between a Controller and the first switch).
To make tapping available make sure you have:
- A correct license
- An EtherTAP placed between two devices communicating over PROFINET
- A running measurement
Network overview and device details
When you click the tile on the Dashboard you can read out four types of data:
The cycle time per device
PROFINET devices send data on a very periodic basis, these are called cycle times. Cycle times are defined in milliseconds.
Positive and negative message jitter as a percentage of the cycle time
Jitter is the deviation of a message from the intended cycle time. Example: if a device sends a message every 4ms, then a delay of an additional 4ms leads to a jitter of 100%. In case the message is 1ms early then a jitter of 25% is being reported. Both messages which are early and late are reported in absolute percentages.
The number of Dropped Packets
Dropped packets are PROFINET messages which were missing in the communication cycle. Healthy PROFINET networks should never drop messages, too many consecutive dropped packets can cause the stop of the network.
The number of Alarms
PROFINET alarms are specific error messages sent by the controller or the devices using the PROFINET protocol.
Message Recording
Osiris records Ethernet packets when something is wrong in the network. Recording is done in the .pcapng format, which allows easy opening in Wireshark.
Three triggers can be used to record a message file:
- PROFINET Alarms
- Jitter too high
- Dropped PROFINET packets
Ethernet Analysis
Select ‘Ethernet’ as the protocol in the top-left drop-down bar to view the Ethernet statistics. These statistics are collected by the EtherTAP of the link it is currently monitoring. Here is possible to analyze the amount of Network load and communication errors happening on the Ethernet link with the timestamp of the last change.
The EtherTAP has a Port A and Port B, which are separately listed, each with their individual statistics.
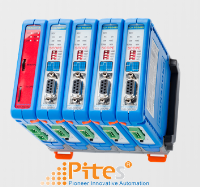
EtherTAP 1G
513-00021A

PROCENTEC is taking diagnostics to the next level. The new EtherTAP monitoring interface is the bridge to the Osiris functionality on our portable Mercury tablet and permanent Atlas module. Both devices run on diagnostics platform Osiris to analyse the information feed from the EtherTAP. This enables our build-in assistant Delphi to come up with a solution to help you to quickly and effectively get your operations running again.
- Passive diagnostics
- Cycle time per device
- Positive and negative message jitter
- Number of dropped packets
- Alarm triggers
The EtherTAP – Message Analysis feature allows you to do deep analysis of PROFINET traffic by placing an EtherTAP between devices exchanging PROFINET traffic (usually between a Controller and the first switch).
To make tapping available make sure you have:
- A correct license
- An EtherTAP placed between two devices communicating over PROFINET
- A running measurement
-
Network overview and device details
When you click the tile on the Dashboard you can read out four types of data:
The cycle time per device
PROFINET devices send data on a very periodic basis, these are called cycle times. Cycle times are defined in milliseconds.Positive and negative message jitter as a percentage of the cycle time
Jitter is the deviation of a message from the intended cycle time. Example: if a device sends a message every 4ms, then a delay of an additional 4ms leads to a jitter of 100%. In case the message is 1ms early then a jitter of 25% is being reported. Both messages which are early and late are reported in absolute percentages.The number of Dropped Packets
Dropped packets are PROFINET messages which were missing in the communication cycle. Healthy PROFINET networks should never drop messages, too many consecutive dropped packets can cause the stop of the network.The number of Alarms
PROFINET alarms are specific error messages sent by the controller or the devices using the PROFINET protocol.Message Recording
Osiris records Ethernet packets when something is wrong in the network. Recording is done in the .pcapng format, which allows easy opening in Wireshark.
Three triggers can be used to record a message file: - PROFINET Alarms
- Jitter too high
- Dropped PROFINET packets
-
Ethernet Analysis
Select ‘Ethernet’ as the protocol in the top-left drop-down bar to view the Ethernet statistics. These statistics are collected by the EtherTAP of the link it is currently monitoring. Here is possible to analyze the amount of Network load and communication errors happening on the Ethernet link with the timestamp of the last change.
The EtherTAP has a Port A and Port B, which are separately listed, each with their individual statistics.
Features
· PROFINET Analysis

The EtherTAP will give insight to the following valuable information...
· Ethernet Analysis

Select ‘Ethernet’ as the protocol in the top-left drop-down bar to view the Ethernet statistics...
·