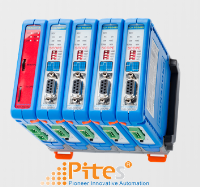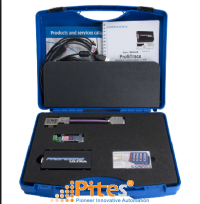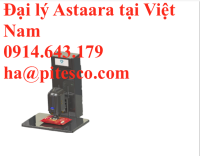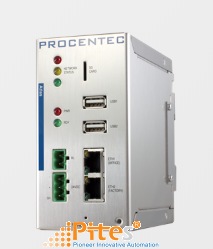
How do you maintain your large factory network? Systems have grown increasingly complex, therefore a solution needed to be designed to create clarity. Atlas is THE vision on the future of Industrial Ethernet Diagnostics. This compact and efficient tool provides you insight and knowledge of networks and an overview of the network health.
- Compact device in a robust housing
- Ease of use
- Clear overview of your network
One tool for understanding your networks
PROCENTEC’s Atlas is an effective tool for everyone in industrial automation who is involved with reducing downtime. Atlas uses easy to understand displays and is therefore easy to use for everyone. Atlas gets installed on a DIN rail, plugged in to your network and then automatically start exploring your network. It will recognize devices and starts getting relevant information from them. A web-based customizable dashboard allows you to see and enclose all information inside the tool. No additional software installations are required.
Simple overview of all devices in your network
One of Atlas’s main features is the dynamic interactive Topology. This is a graphical and hierarchical overview of your complete network. The Topology shows all devices in the network and how they’re connected. This also includes information on all separate devices, using status icons according to NAMUR standard. This way, you’ll get informed about all (possible) problems inside your network. The Topology can be visualized in two different ways: the galaxy view and a more hierarchical tree view. Google Chrome is recommended for optimal user experience.
Quality of your network
Atlas will also provide you with valuable information about the quality of your network. Getting this information used to be very complicated, but Atlas’ Q-Factor (Quality Factor) simplifies this using a weighted algorithm, which is built up from all connected devices in the network. The Q-Factor will show a number from 0 to 5000 (according to the Automotive standard) or 0 to 100% as a relative display. The Q-Factor can also visualize your network’s status A traffic light display allows a more simple overview of the network status in three colors.
Users
- Maintenance & Support
- Plant Manager
- IT Professional
- Network Engineer
- Operator
Your benefits
- Network oversight
- Easy to install via DIN rail
- No software required
- Compact and robust construction
- Ease of use
- 24/7 available
Features Atlas
- Customizable dashboard
- Topology
- Universe and tree structured networks
- Q-Factor
- Device list
- Traffic light
- Alarm notifications
- USB 2.0-support
- SD Card slot
Technical specifications
General specifications
· Dimensions D × W × H: 120mm × 65mm × 120mm (Width without side cover = 63mm)
· Weight: 680 grams
· Material: Metal
· Mounting: DIN rail (minimal 65 mm wide)
Ambient conditions
· Operating temperature: ‐20° ... +60° Celsius
· Storage temperature: ‐20° ... +85° Celsius
· Relative air humidity: 98 %
· Ingress Protection: IP 20 (DIN 40 050)
Electrical specification
· Operating voltage: 12 ... 24 VDC
· Absolute max. rated voltage: 9 ... 32 VDC
· Nominal power use: 4.5 W
· Maximum power use: 20 W
· Input current(24VDC): Typ. 180 mA Max. 840 mA
· RL contact: Max. 220 VDC/ 270mA


 Mr. Hà
 live:ha_1652
